How should we report non-detects and low-concentration data? Our columnists offer an answer.
By Polona Carson and John Carson
Apr 30, 2025
How Should We Report Non-Detects and Low-Concentration Data?
Many decisions are based on low-concentration laboratory data with results below the method detection limit, also known as non-detect results. These data are used as input in statistical analysis to support decisions. Understanding laboratory data to prepare data for analysis is a critical step in this process.
What Are Non-Detect Laboratory Data?
Low-concentration data are common in industries such as environmental, electronics, chemical, petrochemical, petroleum, food, and pharmaceuticals. These industries rely on measurements of analytes at very low concentrations as input for decisions on the quality or acceptability of products, as well as health and environmental risks due to the presence of contaminants or additives in trace amounts.
In low-concentration measurements, analysts make the following decisions:
- Is the analyte detected?
- Is the analyte reliably quantified?
Figure 1 shows schematically the nature of these decisions. The method detection limit (MDL) is a cut-off to differentiate instrument signal from noise, above which the measurement is very unlikely to be due solely to noise in the analytical system. Measurements that are numerically below the MDL are regarded as non-detects. The quantitation limit (QL) is a threshold above which measurements are deemed to be reliable in terms of relative error. Names for, and definitions of, both the MDL and the QL vary due to the lack of standardization across industries.
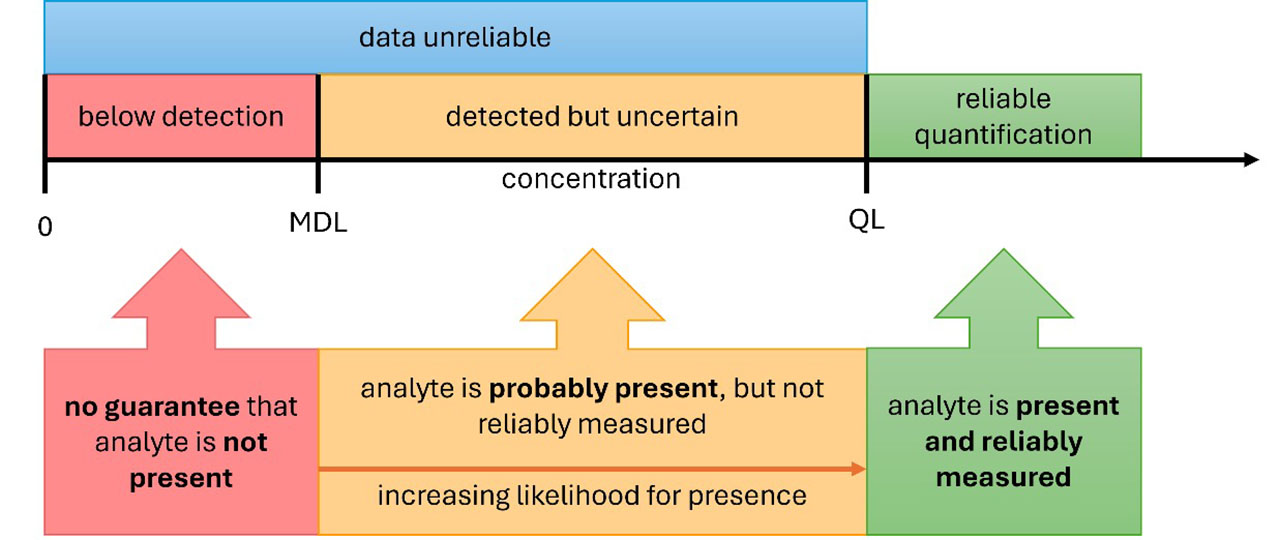
Figure 1: Detection and quantification of measurand
The presumed reliability of reported results is related to definitions of accuracy and precision criteria. There are various approaches to estimating detection and quantification thresholds, and all are based on the estimation of variability for detection, as well as variability and bias for quantification. The MDL is often taken as the 99th percentile of the distribution of measurements of blank samples — that is, samples containing none of the measurand (substance being measured). Detection limits are also sometimes taken as greater than three times the standard deviation of blank samples, or of measurements near the limit. Ten times the blank standard deviation has often been used to define the QL.
Factors that impact both thresholds are the laboratory’s ability to perform low-concentration measurements (instrumentation, analytical method, and analyst skill), and the experimental design and algorithm used to estimate the thresholds. For example, in the environmental industry, some laboratories report sample-specific detection and quantification thresholds because of adjustments for sample weight and dilution. They may in these cases use the word “adjusted” in the threshold definition. Adjustment for dilution can cause the censoring point for detection for some samples to be within the range of reliably determined concentrations for undiluted samples.
Therefore, the detection and quantification thresholds give a fingerprint of a laboratory’s low-level performance and should be determined based on experimental data from each laboratory.
How Are Non-Detects Reported?
We have seen four common approaches to reporting non-detects. The first is to enter the text ND (not detected) or NT (no trace) in the results column. The second is to enter the text “< xx”, where xx is the laboratory determined MDL. The third approach, more common in environmental methods and more useful for the data analyst, is to report the MDL as a numerical value with a separate qualifier code denoting that the result is a non-detect. The qualifier is typically in a separate column. The fourth approach is to report the actual measured value along with a qualifier indicating whether the value represents a non-detect and/or other quality issues with the measurement.
The second and third approaches present the non-detect result as left-censored. A left-censored result means that we do not see the actual measured value but know that it is below a threshold called the censoring point. This does not mean that the analyte is not present, but that its concentration in the measured sample may be very small, somewhere between the MDL and zero. For a data analyst, these two approaches are more useful than having a non-detect reported as ND.
The fourth approach does not censor the data at all but indicates whether the result should be regarded as a detected value. This approach is commonly used for radiological measurements. For the data analyst, this is the most useful practice of all but may not always be acceptable for the laboratory client.
Recommended Guidelines
There are currently no general ASTM guidelines or standards (that we are aware of) that address reporting of non-detects or low-level data with higher relative error (data between MDL and QL). There is also no guidance in this area in the environmental industry, which we are very familiar with. A consequence is that environmental laboratories report low-level results for the same methods using entirely different reporting conventions.1
The recommended data reporting format has the following fields: sample ID, result, qualifier, MDL, and QL. The result is a reported numerical value for analyte concentration. Non-detects are reported as numerical values equal to either the actual measurement or the laboratory-specific MDL.
The qualifier column contains the laboratory-reported data qualifier code, which indicates non-detects and/or various quality issues. For example, in the environmental industry a J qualifier code indicates an estimated value and is often used for measurements that lie between the MDL and the QL. The absence of a qualifier signifies a reliable result with no quality issues.
The MDL column contains the laboratory-specific detection thresholds. The column QL contains the laboratory-specific quantification or reporting thresholds. Sometimes laboratories choose to use a value somewhat higher than the QL as a reporting limit (RL). The significance of the RL is that values above this limit are reported without a qualifier, unless there are additional quality problems. These other issues would most often use a different qualifier code than that used for estimated values measured between the MDL and the QL/RL.
Conclusion
Differences in laboratory reports due to the lack of guidance on the definition and algorithms for determining the detection and quantification thresholds of analytical results cause challenges with interpretation, management, and use of low-level data.
Currently, there is no guidance for how to report left-censored (non-detect) laboratory data, which leads to inconsistencies in interpretation and analysis of data. There is an opportunity for the development of a guide recommending data-reporting approaches for laboratory results with non-detects. Having such a guide will help achieve better consistency in reporting in using laboratory data and consequently, improve the quality of decisions made based on left-censored data. ●
References
1) P. K. Carson, “Interpreting and Managing Laboratory Data below the Quantification and Detection Threshold,” Journal of Testing and Evaluation 52, No. 5 (Sep/Oct 2024): 2729–2734.
https://doi.org/10.1520/JTE20240068.
Polona Carson, Ph.D., MBA, is senior scientist and project manager at Neptune and Co. Carson is also a vice chair of the committee on quality and statistics (E11).
John Carson, Ph.D., is senior statistician for Neptune and Co. and the Data Points column coordinator. Carson is a member of the committees on quality and statistics (E11); petroleum products, liquid fuels, and lubricants (D02); air quality (D22); environmental assessment, risk management, and corrective action (E50); and personal protective clothing and equipment (F23).
May / June 2025